
Immunoassay explained
Veterinary fluorescence immunoassay: how qFLASH works
Follow the qFLASH signal from antigen–antibody binding to a calibrated result, and see which details to check for each assay.
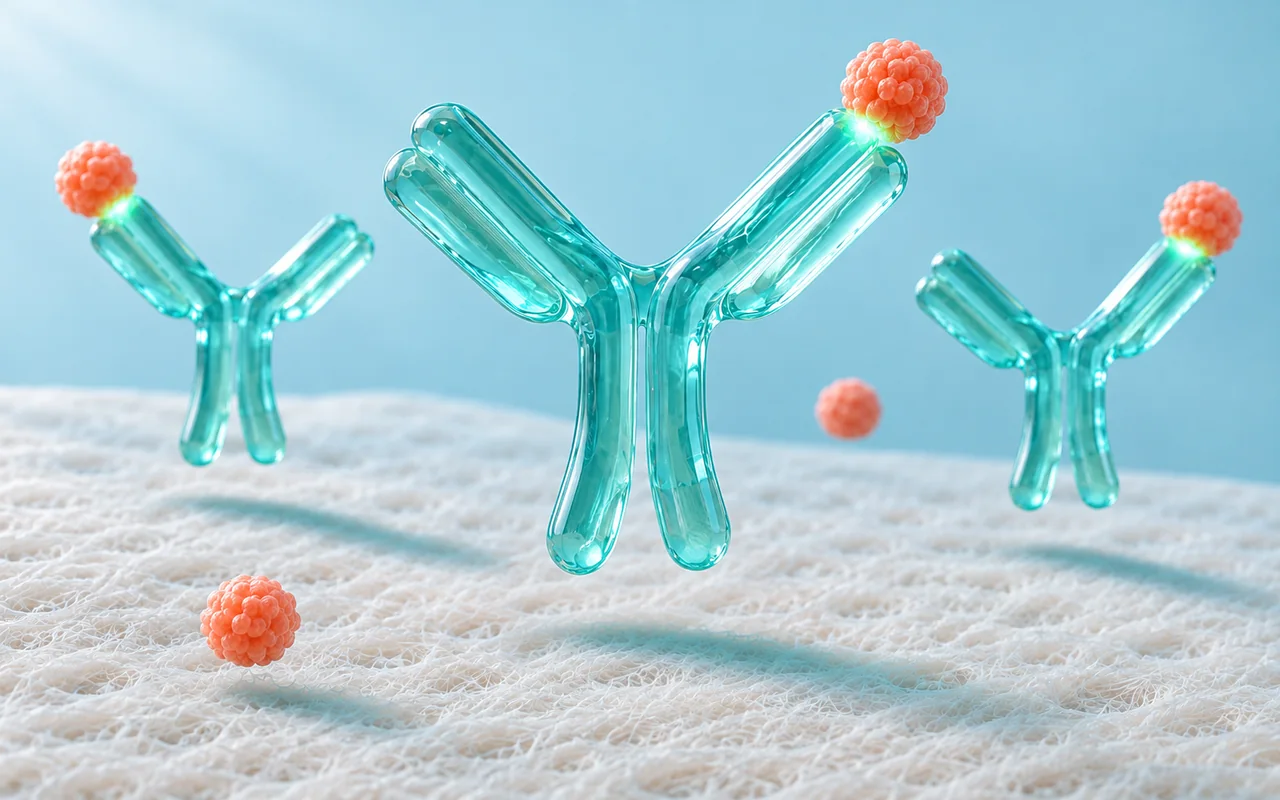
A veterinary fluorescence immunoassay combines biological recognition with an optical measurement. Antigen–antibody binding identifies the target; a fluorescent label provides the signal that an analyzer reads. In the qFLASH sandwich-format example described here, that signal is converted into an antigen concentration using a calibration curve.
Understanding this sequence helps a laboratory team explain what the instrument measures and prepare for a demonstration. It also helps distributors distinguish the analyzer, the test cartridge and the individual assay instructions when presenting a platform to customers.
This guide follows Dawnsail’s current qFLASH principle explanation. It describes the supplied antigen-detection example; the reaction design and operating requirements of other qFLASH assays must be checked in their own instructions.
What happens inside a qFLASH test strip?
The supplied explanation divides the process into three stages: sample preparation, lateral flow and fluorescent signal detection. Each stage has a different role in turning a prepared specimen into a reported measurement.
1. The prepared sample enters the strip
The operator prepares the sample according to the selected test manual, then adds the sample solution to the strip’s sample well. At this point, the assay instructions determine the permitted specimen, preparation method and loading requirements.
A shared analyzer does not establish a universal specimen rule. For example, choosing a qFLASH instrument is a platform decision; choosing the correct specimen and preparation procedure is an assay decision. Keep the exact test instructions beside the relevant training material.
2. Binding creates a captured complex
As the solution travels along the strip, the target antigen binds to an antibody carrying a fluorescent particle label. A capture antibody at the test line then holds the complex in place. In this sandwich-format explanation, the antigen sits between the labelled antibody and the capture antibody. 1
The two antibody roles are different: one carries the detectable label, while the other captures the complex at the measurement location. This is the recognition stage of the described assay. The instrument’s light source is used later to read the label.
3. The analyzer reads the fluorescent signal
The analyzer excites the particle label and detects its fluorescence. It then applies a calibration curve to convert the measured signal into an antigen concentration. The result therefore comes from an assay-specific relationship between signal and concentration, rather than from a visual judgment of line darkness. 1
Swipe horizontally to read the full table.
| Part of the process | Its role in the supplied qFLASH example | What to check in the assay documents |
|---|---|---|
| Sample preparation | Provides the sample solution for the strip | Accepted specimen, preparation and loading requirements |
| Labelled antibody | Binds the target antigen and carries the fluorescent label | Exact assay identity and compatible consumable |
| Capture antibody | Holds the complex at the test line | The reaction principle described for that test |
| Optical reading | Measures the fluorescent signal | Required reading procedure and instrument compatibility |
| Calibration | Relates signal to a concentration | Units, measuring interval and applicable calibration instructions |
Why does calibration matter?
A fluorescent signal is an instrument measurement. A concentration is an interpreted measurement expressed in the units defined for the assay. The calibration curve connects the two in the supplied qFLASH example.
For practical training, ask operators to identify the assay name, reported unit and measuring interval before discussing a result. If a report uses a flag or a value outside the stated interval, use that test’s reporting instructions. This guide does not supply a universal cutoff or a rule for converting readings between different assays.
When reviewing a demonstration, also ask which calibration information belongs to the selected reagent and how the documented procedure handles it. The purpose is to understand the actual workflow, rather than assume that every test uses an identical setup.
Does every immunoassay measure an antigen concentration?
No. Immunoassays can be designed to detect antigens or antibodies, and their output depends on their intended purpose. Cornell’s veterinary serology and immunology laboratory describes both antigen and antibody detection among its diagnostic activities. That general distinction does not establish which reaction format any particular qFLASH test uses. 2
The qFLASH principle illustrated above is specifically a sandwich-format antigen example. Do not extend it automatically to every biomarker, hormone or antibody assay in a platform menu. Check the individual document for the measured target and whether the reported result is a concentration, a category or another defined output.
For the broader difference between immune recognition and genetic-target detection, read our comparison of veterinary immunoassay and molecular testing.
How should a laboratory review the test menu?
Start with a small group of required tests and build a document checklist for each one. The qFLASH biomarker test platform groups the current menu into application areas. Its available materials include examples such as canine C-reactive protein and SDMA; an item appearing in a menu is the starting point for review, rather than the complete operating specification.
For each shortlisted assay, record:
- Target and species: the intended measurement and the animal species covered by the instructions.
- Specimen and preparation: the accepted specimen, handling conditions and any preparation equipment.
- Reported output: units, measuring interval, flags and the interpretation information supplied for that assay.
- Quality checks: the applicable control, calibration, invalid-result and repeat-testing procedures.
- Supporting evidence: the study population, specimen types, comparator and performance measures relevant to the intended use.
For infectious-disease assays, WOAH’s validation guidance specifically connects test suitability to its intended purpose, species and specimen. It also calls for monitoring performance during routine use. This is useful context when reviewing assay evidence; it is not a statement that WOAH has evaluated or endorsed qFLASH. 3
What makes a useful qFLASH training session?
Organize the session around one documented assay from start to finish. Bring the current instrument manual, that assay’s instructions, its consumables and the matching operation video from the Dawnsail resource library.
During the demonstration, identify the specimen and reagent, follow the specified preparation and loading sequence, and review how the result appears. Record questions about the quality checks and handling of flagged or invalid results. A video is useful for showing the physical sequence, while the written instructions provide the exact operating requirements.
End with an operator checklist that references document versions. This gives the laboratory a practical record for training and gives the distributor a clear list of questions to resolve before implementation. If the intended test menu is already defined, send the assay shortlist to Dawnsail with the target market and laboratory setting.
Common questions
Is fluorescence itself the diagnostic target?
No. Fluorescence is the readout. In the example described here, the target is an antigen, recognition occurs through antibody binding, and the fluorescent label makes the captured complex measurable.
Can I use the same preparation procedure for every qFLASH test?
Use the instructions for the selected assay. Sharing an analyzer does not, by itself, establish identical specimen types, preparation volumes, timing or interpretation rules.
Does a numerical result establish a diagnosis on its own?
The number describes the assay’s reported measurement. Its clinical meaning depends on the intended use and the veterinarian’s assessment. This article explains the measurement process and does not set diagnostic cutoffs.
Sources and product documents
Product-specific descriptions follow Dawnsail’s October 2026 principle text and current resource library. The external references provide general veterinary testing and validation context, not independent validation of the qFLASH system.
- Dawnsail — qFLASH principle and supporting materials. Sample preparation, sandwich-format lateral flow and signal-to-concentration conversion.
- Cornell University — Serology & Immunology. Antigen and antibody detection in veterinary diagnostics.
- WOAH — Validation of Diagnostic Assays for Infectious Diseases of Terrestrial Animals (PDF). Intended purpose, species, specimen and routine performance monitoring.